How the smart fraction (vide Griffe du Lion); physician fraction &scientist fraction scale with mean IQ in the range. I arrived at values for physician fraction &scientist fractions independently by myself but it is notable that a noted IQ worker Gottfredson give similar values.
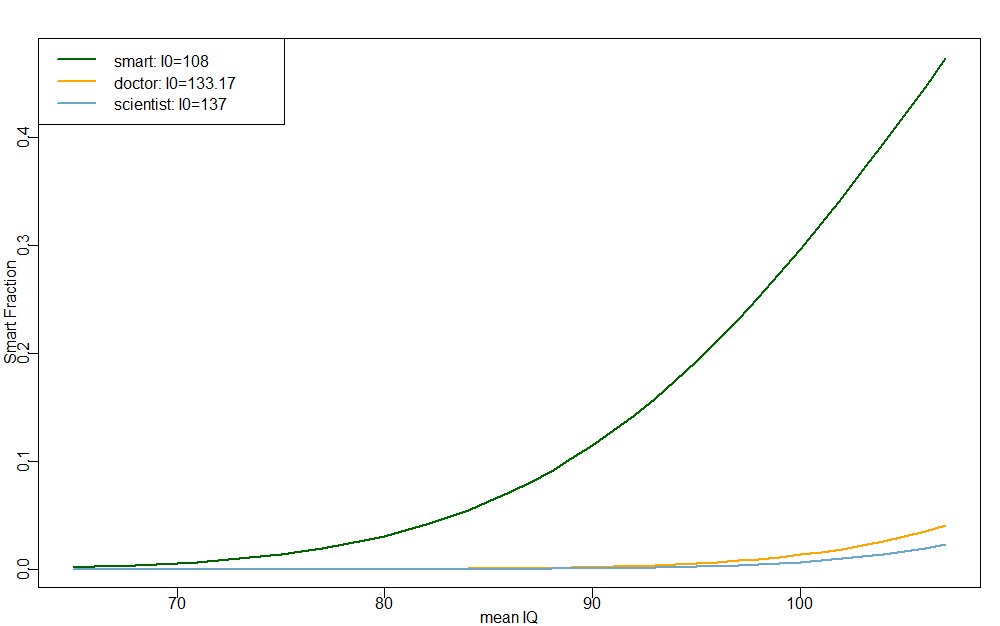
(I0: the IQ threshold beyond which the area under the distribution curve gives you the IQ fraction required for being part of smart fraction or being a doctor or a scientist)
There are no entirely reliable estimates of Indian IQ. 1 average estimate that has been widely proposed is 85. Assuming a constant s.d of 15 we get the below table; Here “smart fraction” is # of people with IQ>108 which an author going by the name du Lion proposes to be a powerful predictor of national economic performance.
I use IQ>=137 as the scientist fraction i.e. that fraction of population that can be effective scientists who produce science/math/tech innovations.
| IQ : | Pop | Smart Frac | Sci. Frac | |
|---|---|---|---|---|
| India | 85 | 1.324e+09 | 82878260 | 348844.2 |
| China | 103 | 1.379e+09 | 509459608 | 16141606 |
| USA | 100 | 323100000 | 95928852 | 2203174 |
| Mongolia | 101 | 3027000 | 969757 5 . | 24813 94 |
From different kinds of experience in desh I think that the Indian IQ might actually have a mean of around 94. If we assume this then we get the below table for the same: This would imply we have roughly similar absolute # of sci. frac individuals as the US.
| IO | Pop | Smart Frac | Sci Frac | |
|---|---|---|---|---|
| India | 94 | 1.324e+09 | 232128903 | 2746106 |
| China | 103 | 1.379e+09 | 509459608 | 16141606 |
| USA | 100 | 323100000 | 95928852 | 2203174 |
| Mongolia | 101 | 3027000 | 969757.5 | 24813.94 |
There is no indication thus far that chIna-s have the excess indicated in the table. This might arise from the verbal/quant differentiation in different populations as du Lion speculated. Others have said there might be chIna boosterism in play.
If we take another lower but perhaps more realistic chIna estimate & add a few other countries with their own caveats we get this table
| IO | Pop | Smart Frac | Sci Frac | |
|---|---|---|---|---|
| India | 94 | 1.324e+09 | 232128903 | 2746106 |
| China | 101.5 | 1.379e+09 | 458360725 | 12375898 |
| USA | 100 | 323100000 | 95928852 | 2203174 |
| Japan | 104 | 1.27e+08 | 50147590 | 1765738 |
| UK | 100 | 53010000 | 15738745 | 361467.9 |
| Germany | 102 | 82670000 | 28486285 | 811433.2 |
| Mongolia | 101 | 3027000 | 969757.5 | 24813.94 |
- mentioned upfront no truly reliable estimates
- these are reasonable starting points - not way out.
- distribution will remain normal but may be s.d is greater indeed (that may be true of chIna-s too I think). Let’s assume a reasonable s.d=17 then we get:
| IO | Pop | Smart Frac | Sci Frac | |
|---|---|---|---|---|
| India | 94 | 1.324e+09 | 271557033 | 7563608 |
| China | 101.5 | 1.379e+09 | 458360725 | 12375898 |
| USA | 100 | 323100000 | 95928852 | 2203174 |
| Japan | 104 | 1.27e+08 | 50147590 | 1765738 |
| UK | 100 | 53010000 | 15738745 | 361467.9 |
| Germany | 102 | 82670000 | 28486285 | 811433.2 |
| Mongolia | 101 | 3027000 | 969757.5 | 24813.94 |