Source: here.
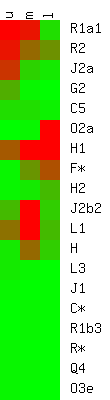 A recent paper by Sengupta et al in AJHG caused much excitement in some circles, because it was seen by some as providing evidence that the Indo-Europeans/Aryans may not have invaded India after all. The paper provides a wealth of Y-chromosome haplogroup data with extensive sampling of several Indian communities. The conclusions of the paper itself are a bit confused and it does not do full justice to the data it analyzes. So we decided to reanalyze the data and reach some tentative conclusions. A summary of the analysis is presented in the form of a vector diagram showing the frequencies of individual haplogroups (rows). Redder the box the more frequent is a haplogroup. The 3 main groups
(columns) are upper castes (brAhmaNas and rAjpUts= u), middle-lower
castes (Marathas, Mahishyas, Vellalar, Vanniyar, Pallar etc=m), and scheduled or nomadic tribes/castes (Toda, Irula, Konda Reddi, Kota, Santhal, Muria, Kammar etc=l). One thing that strikes you is that there are clear frequency differences of Haplogroups that demarcate these social strata (As was earlier suggested by Cordaux et al).
A recent paper by Sengupta et al in AJHG caused much excitement in some circles, because it was seen by some as providing evidence that the Indo-Europeans/Aryans may not have invaded India after all. The paper provides a wealth of Y-chromosome haplogroup data with extensive sampling of several Indian communities. The conclusions of the paper itself are a bit confused and it does not do full justice to the data it analyzes. So we decided to reanalyze the data and reach some tentative conclusions. A summary of the analysis is presented in the form of a vector diagram showing the frequencies of individual haplogroups (rows). Redder the box the more frequent is a haplogroup. The 3 main groups
(columns) are upper castes (brAhmaNas and rAjpUts= u), middle-lower
castes (Marathas, Mahishyas, Vellalar, Vanniyar, Pallar etc=m), and scheduled or nomadic tribes/castes (Toda, Irula, Konda Reddi, Kota, Santhal, Muria, Kammar etc=l). One thing that strikes you is that there are clear frequency differences of Haplogroups that demarcate these social strata (As was earlier suggested by Cordaux et al).
-The R1a1, R2, J2a G2 (G2-P15) are clearly high in upper caste, and decline in middle-lower castes and almost vanish in the lower castes.
-The O2a, H1, F* and H2 haplogroups are predominantly seen in the mainland tribal population and decline in the middle-lower castes and are low or almost absent in upper castes.
-Not shown in this diagram is the O3e marker that is predominantly seen in the Tibeto-Burman speaking eastern tribals (who also have some O2a), and nearly absent elsewhere. The median joining analysis of the O2a haplogroup shows that they are two distinct clusters, one with greater diversity including the Austro-asiatic and Dravidian tribals and the second the lower diversity one including the Tibeto-Burman tribals.
-Interestingly J2b2 (first properly defined in the Sengupta study), L1 and H are dominant in the middle-low strata and decline in both the upper and tribal groups.
The R1a1 marker is elsewhere seen in the Central Asians and Eastern Europeans; J2a and G2-P15 appear to peak in the Middle East, Anatolia and the Caucusus with some presence in Europe. G2-P15 is interestingly found only in Iyer and Iyengars in this set at a high 10-12 %. Another study interestingly showed a similar rare haplotype N1a to be present in similar percentages in the Havik Brahmins of Karnataka. This marker is found elsewhere in the regions bordering the Eurasian steppe zone and to some extant in Iran. It was also found in the early European settlers belonging to the Linearbandkeramik (Haak et al in Science Magazine) who are supposed to have spread agriculture to Central and Northern Europe.
L1 marker is predominant in Tamils and to some extant in Marathas, with the most prevalent presence in Tamil middle castes like Vellalars, Vanniyars, Ambalavasis and the like. It is low or absent in most of the Dravidian tribal groups outside Tamil Nad, though it is present in Brahmins in the Tamil region. It is also peculiarly found in Balochistan and Makran but low in the Brahui speakers.
The mainland tribal populations, both Dravidian and Austro-Asiatic are rich in O2a or H1 or both.
To cut a long story short we provide an interpretation of this data: The main problem with the interpretations offered by the authors are: 1) their improper grouping of the jAtis and other populations and 2) their steadfast adherence to a model that the IE invaders of India should have come in only around 1500 BC. They also harp about frequency analysis being inadequate but do not go beyond it to use the alternative methods fruitfully. It would be simple to interpret the R1a1, J2a, G2-P15, N1a and perhaps some R2 as being borne mainly by the Eurasian Indo-European populations entering India. Of these J2a, N1a and G2-P15 is clearly absent in non-upper caste populations, and shared with western Eurasian populations. R1a and R2 is seen to have lower diversity in the caste populations in contrast to tribals, which the authors suggest as meaning that admixture did not cause their emergence in the tribals. This to say the least is a very simplisitic explanation. One more consistent with historical data is that R1a and perhaps R2 expanded in the Central/Western Asian zone close to the boundary of the Eurasian steppes somewhere between 10-15,000 years BP. These two seem to have then seeped into India at a gradual rate seeding the indigenous tribal groups with R1a1 males at some low rate. The main bulk of the less diverse R1a1 appears to have come from Western/Central Eurasia along with the other above-mentioned Western Eurasian markers where it had already differentiated into eastern and western branches. The time of divergence with the central Asian R1a1 comes to around 6000-10000yrs bp. This along with the early separation dates for J2a suggest that these are easily explained by accounting for an early origin for Indo-Europeans of India. This makes the possibility of an Indo-Aryan Indus civilization a possibility. The early Kentum substratum in Bangani in India could also be a part of earlier waves bearing similar haplogroups. Finally, the cline of markers from Western Eurasian suggest a low angle Northwestern early influx of Indo-Europeans into India. We wonder if this might actually represent the Neolithic wave of Indo-Europeans preceeded by some Mesolithic seepage.
In interior India we find an interesting effect: The O2a and the H1 markers. We believe that these two represent Y-chromosomes of indigenous populations. The O2a marker is seen in all tribal groups but hardly in any caste groups, suggesting that it was indeed one of the markers of the earliest population. In contrast to O2a, H1 while highest in the tribal populations is also seen in caste population in a declining gradient. It was in this early population that probably Austro-Asiatic, Nahali, Kusunda and possibly Indo-Pacific languages arose. Of these the Austro-Asiatic and Dravidian languages showed an expansion.
O2a is present in Indian tribal populations speaking Dravidian, Austro-Asiatic and Sino-Tibetan, as well as far Eastern populations in China, Burma and the states of Indo-China in Indian. Both the frequency and variance plots of the O2a haplogroup show an increasing Eastern component. This would imply that its expansion was probably associated with an Eastern population expansion and emigration. The expansion probably corresponded with the Austro-Asiatic expansion. In the outer zones these populations probably were incorporated into Dravidian speaking and Sino-Tibetan populations which were also expanding.
H1 in contrast is hardly present in Sino-Tibetan and Eastern populations. Its centre gravity in terms of frequency is the central part of the country from where it appears to have expanded outwards. We explain H1 expansion as an expansion of agricultural indigenous population associated with Central and South Indian archaeological cultures like Jorwe and Daimabad and these agricultural groups managed ascend the ladder of the Indo-Aryan hierarchy coming in from the North.
L1 which is restricted to Tamil population but seen across caste boundaries albeit with the greatest presence in the middle-low castes is interpreted as not being spread by the Dravidians. As most Dravidian tribals have it lower levels and it is absent in Dravidians outside Tamilnad we specifically see at the haplogroup expanded by the proto-Tamil cultural rennaisance, probably archaeologically corresponding to the expansion of the Megalithic (neDukkal/vira-kal) culture. This appears to have expanded from the middle of the peninsular India somewhat Northwards to coastal Pakistan and Makran and of course its main center was the Tamil country. This expansion possibly also bore with it the H1 marker, further driving it up the caste hierarchy. We suspect that the Tamil upper castes absorbed native priests as kurukals and the like that resulted in the influx of L1 into their ranks.